Overview
Mathmaker Lib offers python objects to create mathematical expressions or geometric figures to print as LaTeX. These objects can also be used to create detailed calculations, like equations resolutions or expressions expansions.
Quickstart
Install
OS requirement: Linux, FreeBSD or Windows.
The required python version to use Mathmaker Lib is python>=3.6. You’ll need to install it if it’s not already on your system.
$ pip3 install mathmakerlib
Basic use
Numbers
>>> from mathmakerlib.calculus import Number
>>> Number('5.807')
Number('5.807')
>>> Number('5.807').atomized()
[Number('5'), Number('0.8'), Number('0.007')]
>>> Number('150').is_power_of_10()
False
>>> Number('0.001').is_power_of_10()
True
>>>
You can also play with units. Basic operations are available:
>>> n = Number(4, unit='cm')
>>> n
Number('4 cm')
>>> str(n)
'4 cm'
>>> n.unit
Unit('cm')
>>> n.printed
'\\SI{4}{cm}'
>>> n + Number(6, unit='kg')
Traceback (most recent call last):
  File "<stdin>", line 1, in <module>
  File "/home/nico/dev/mathmaker/mathmakerlib/mathmakerlib/calculus/number.py", line 177, in __add__
    other_unit))
ValueError: Cannot add two Numbers having different Units (cm and kg).
>>> n * Number(6, unit='cm')
Number('24 cm^2')
>>>
Polygons
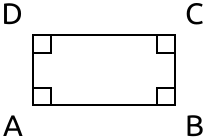
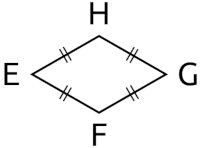
Examples of a default Rectangle and default Rhombus.
>>> from mathmakerlib.geometry import Rectangle, Rhombus
>>> print(Rectangle().drawn)

\begin{tikzpicture}
% Declare Points
\coordinate (A) at (0,0);
\coordinate (B) at (2,0);
\coordinate (C) at (2,1);
\coordinate (D) at (0,1);

% Draw Rectangle
\draw[thick] (A)
-- (B)
-- (C)
-- (D)
-- cycle;

% Mark right angles
\draw[thick, cm={cos(0), sin(0), -sin(0), cos(0), (A)}] (0.25 cm, 0) -- (0.25 cm, 0.25 cm) -- (0, 0.25 cm);
\draw[thick, cm={cos(90), sin(90), -sin(90), cos(90), (B)}] (0.25 cm, 0) -- (0.25 cm, 0.25 cm) -- (0, 0.25 cm);
\draw[thick, cm={cos(180), sin(180), -sin(180), cos(180), (C)}] (0.25 cm, 0) -- (0.25 cm, 0.25 cm) -- (0, 0.25 cm);
\draw[thick, cm={cos(-90), sin(-90), -sin(-90), cos(-90), (D)}] (0.25 cm, 0) -- (0.25 cm, 0.25 cm) -- (0, 0.25 cm);

% Label Points
\draw (A) node[below left] {A};
\draw (B) node[below right] {B};
\draw (C) node[above right] {C};
\draw (D) node[above left] {D};
\end{tikzpicture}

>>> print(Rhombus().drawn)

\begin{tikzpicture}
% Declare Points
\coordinate (E) at (0,0);
\coordinate (F) at (0.866,-0.5);
\coordinate (G) at (1.732,0);
\coordinate (H) at (0.866,0.5);

% Draw Rhombus
\draw[thick] (E)
-- (F) node[midway, sloped, scale=0.5] {||}
-- (G) node[midway, sloped, scale=0.5] {||}
-- (H) node[midway, sloped, scale=0.5] {||}
-- cycle node[midway, sloped, scale=0.5] {||};

% Label Points
\draw (E) node[left] {E};
\draw (F) node[below] {F};
\draw (G) node[right] {G};
\draw (H) node[above] {H};
\end{tikzpicture}
Once compiled (still using Ubuntu font):
>>> from mathmakerlib.calculus import Number
>>> from mathmakerlib.geometry import Polygon, Point, AngleDecoration
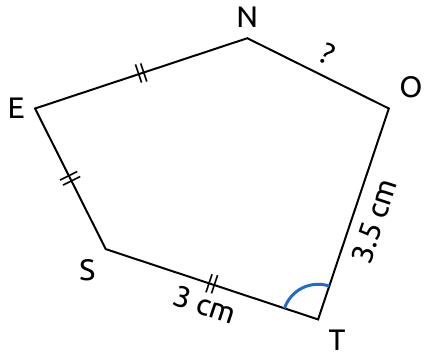
>>> p = Polygon(Point(0, 0), Point(3, -1), Point(4, 2), Point(2, 3), Point(-1, 2), name='STONE')
>>> p.setup_labels([Number(3, unit='cm'), Number(3.5, unit='cm'), Number(2.5, unit='cm'), Number(3, unit='cm'), Number(3, unit='cm')], masks=[None, None, '?', ' ', ' '])
>>> p.sides[0].mark = p.sides[3].mark = p.sides[4].mark = '||'
>>> p.sides[0].mark_scale = p.sides[3].mark_scale = p.sides[4].mark_scale = Number(0.67)
>>> p.angles[1].decoration = AngleDecoration(color='NavyBlue', thickness='very thick', radius=Number(0.5, unit='cm'))
>>> print(p.drawn)
\begin{tikzpicture}
% Declare Points
\coordinate (S) at (0,0);
\coordinate (T) at (3,-1);
\coordinate (O) at (4,2);
\coordinate (N) at (2,3);
\coordinate (E) at (-1,2);
% Draw Pentagon
\draw[thick] (S)
-- (T) node[midway, below, sloped] {\SI{3}{cm}} node[midway, sloped, scale=0.67] {||}
-- (O) node[midway, below, sloped] {\SI{3.5}{cm}}
-- (N) node[midway, above, sloped] {?}
-- (E) node[midway, sloped, scale=0.67] {||}
-- cycle node[midway, sloped, scale=0.67] {||}
pic [draw, very thick, angle radius = 0.5 cm, NavyBlue] {angle = O--T--S};
% Label Points
\draw (S) node[below left] {S};
\draw (T) node[below right] {T};
\draw (O) node[above right] {O};
\draw (N) node[above] {N};
\draw (E) node[left] {E};
\end{tikzpicture}
>>> p.lbl_perimeter
Number('15 cm')
>>> p.type
'Pentagon'
>>> import mathmakerlib.required
>>> print(mathmakerlib.required.tikz_library)
{'angles': True, 'decorations.markings': False, 'quotes': False}
>>>
Once compiled (still using Ubuntu font, take care to include angles tikz library):
Polyhedra
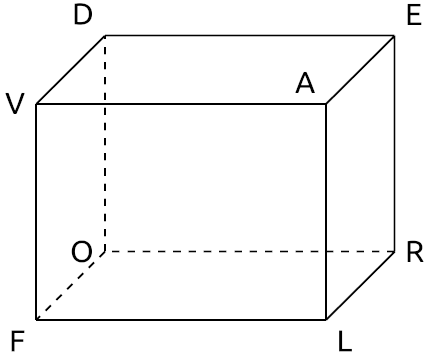
>>> from mathmakerlib.geometry import RightCuboid, ObliqueProjection
>>> rc = RightCuboid(dimensions=(4, 3, 2), name='FLAVORED')
>>> print(ObliqueProjection(rc, label_vertices=True).drawn)

\begin{tikzpicture}
% Declare Points
\coordinate (F) at (0,0);
\coordinate (L) at (4,0);
\coordinate (A) at (4,3);
\coordinate (V) at (0,3);
\coordinate (O) at (0.948,0.948);
\coordinate (R) at (4.948,0.948);
\coordinate (E) at (4.948,3.948);
\coordinate (D) at (0.948,3.948);

% Draw Oblique Projection of RightCuboid
\draw[thick] (F) -- (L);
\draw[thick] (L) -- (A);
\draw[thick] (A) -- (V);
\draw[thick] (V) -- (F);
\draw[thick] (L) -- (R);
\draw[thick, dashed] (R) -- (O);
\draw[thick, dashed] (O) -- (F);
\draw[thick] (A) -- (E);
\draw[thick] (E) -- (R);
\draw[thick] (V) -- (D);
\draw[thick] (D) -- (E);
\draw[thick, dashed] (O) -- (D);


% Label Points
\draw (F) node[below left] {F};
\draw (L) node[below right] {L};
\draw (A) node[above left] {A};
\draw (V) node[left] {V};
\draw (O) node[left] {O};
\draw (R) node[right] {R};
\draw (E) node[above right] {E};
\draw (D) node[above left] {D};
\end{tikzpicture}
Once compiled (still using Ubuntu font):
Contribute
Before submitting a PR, please ensure you’ve had a look at the mathmaker’s writing rules.
So far, more details can be found in the documentation for developers of mathmaker.
Any question can be sent to nh dot techn (hosted at gmail dot com).
Contributors
Development
- Lead developer: Nicolas Hainaux
- Clever advices: Olivier Cecillon
Patience and chocolate cakes
Sophie Reboud
Changelog
Version 0.7 (2018-06-18)
- Now Points, as well as other basic geometric objects, may be 2D or 3D.
- Add first three-dimensional objects: Polyhedron and RightCuboid.
- Add first flat representation of polyhedra: ObliqueProjection
- Extend units conversions to areas, volumes and conversions between capacities and volumes (from m³ to mm³).
- Add ClockTime object to easily deal with times.
- Accept floats to initialize Numbers (the float being converted to str).
Version 0.6 (2018-04-12)
- A standalone Angle or AnglesSet can be drawn. Enrich Angles’ decorations (hatch marks, labeling, second decoration etc.).
- An integer Number can be split as a sum of integers ± 0.5 (or ± 0.25)
- Add Number.lowest_nonzero_digit_index()
- Patch Number.split() to get a consistent behaviour for integers too (default split will be done at lowest non zero digit place: 500 will be split as 100 + 400, or 200 + 300 etc. and with dig=1, it will be split as 10 + 490, or 20 + 480 etc.).
- Fix: Numbers with an angle’s unit should be displayed as \ang{…} rather than \SI{…}{\textdegree}.
- Add basic classes to handle LaTeX commands and options’ lists.
Patches 0.6.1 to 0.6.4 (2018-04-13, 2018-04-30, 2018-05-02 and 2018-05-05)
- Add a constant in LaTeX module
- Add Number.digits_sum()
- Add Number.digits and Number.digit()
- Add some amsmath symbols.
Version 0.5 (2018-01-10)
- Add Number.quantize().
- A Number can be converted into a another unit of the same physical quantity.
- Accept int as exponent (or even content) of an Exponented.
- Fractions can be created from a decimal Number.
- Fractions become Evaluable and can be compared to other numbers.
- Standalone Units will be printed using siunitx (e.g. as ‘\si{cm}’).
- Fix bug: current locale is ignored when printing a number having a unit.
- Do not automatically remove possible trailing zeros when printing a Number.
- Add the tonne (t) as mass unit.
- An optional patch allow Polygons to be drawn to the first vertex again instead of only cycling (default behaviour).
Version 0.4 (2017-12-19)
- Add more complex geometric objects: Polygon, Triangle, RightTriangle, EquilateralTriangle, IsoscelesTriangle, Quadrilateral, Rhombus, Rectangle, Square.
- Numbers can be “copied” using copy.copy() or copy.deepcopy().
- Add Point.rotate().
- Add the ability to change the size of Point’s drawn shape (using Point.shape_scale).
- Add LineSegment.mark and the ability to change its size (using LineSegment.mark_scale).
- mathmakerlib.requires_pkg becomes mathmakerlib.required and will also handle required options and hacks.
- Add module mathmakerlib.mmlib_setup to configure the behaviour (default values etc.).
Patch 0.4.1 (2018-01-01)
- Fix the locale monkey patch.
Version 0.3 (2017-11-17)
- Add basic geometric objects: Point, LineSegment and DividedLineSegment.
- Add Fraction.
- Add module mathmakerlib.requires_pkg that tells which LaTeX packages will be required to compile the document (like tikz, xcolor, siunitx…).
Version 0.2 (2017-11-01)
- Add Sign, Exponented and Unit classes.
- Numbers are now Signed objects and may be assigned a Unit.
Patches 0.2.1 and 0.2.2 (2017-11-02)
- Bring back Numbers’ hashability.
- Add physical_quantity() in unit module.
Initial version 0.1 (2017-10-24)
- Number class and decimal numbers’ related functions.